How to tune the MTR-1 using Home Assistant
Prefer a guided dashboard?
The Apollo mmWave integration gives your Apollo MTR-1 its own dashboard tab with a zone map where you draw zones over the radar's live targets, with no Plotly card or YAML to set up. The Apollo mmWave dashboard guide walks you through it as a guided alternative to the manual steps below.
This guide shows you how to set up your MTR-1's three zones by entering the X and Y coordinates for each one. First you add a card to your dashboard that shows the radar's live targets, then you use it to work out the coordinates for each zone, in millimeters. You can enter the values in Home Assistant, as shown below, or directly on the device's web page by visiting its IP address or hostname.local.
Tuning with the HLK Radartool app is much easier, and it's the method we suggest for setting up your MTR-1.
Add the target card to your dashboard
Start by adding a Plotly card that draws the radar's coverage area, your three zones, and the targets the radar sees.
1. Install HACS.
2. Download Plotly inside HACS.
3. In the tool below, enter your device's full name and, if you like, rename the three zones. Then click Generate YAML and Copy YAML.
Not sure of your device name? Go to the ESPHome Integrations page (Settings → Devices & services → ESPHome), select your device, and look for the full name. Unless you've renamed it, it looks something like apollo_mtr_1_c64a28, ending in six random characters.
4. Open a dashboard and click the pencil icon to edit it. Click one of the large + signs, type "manual", and select the Manual card.
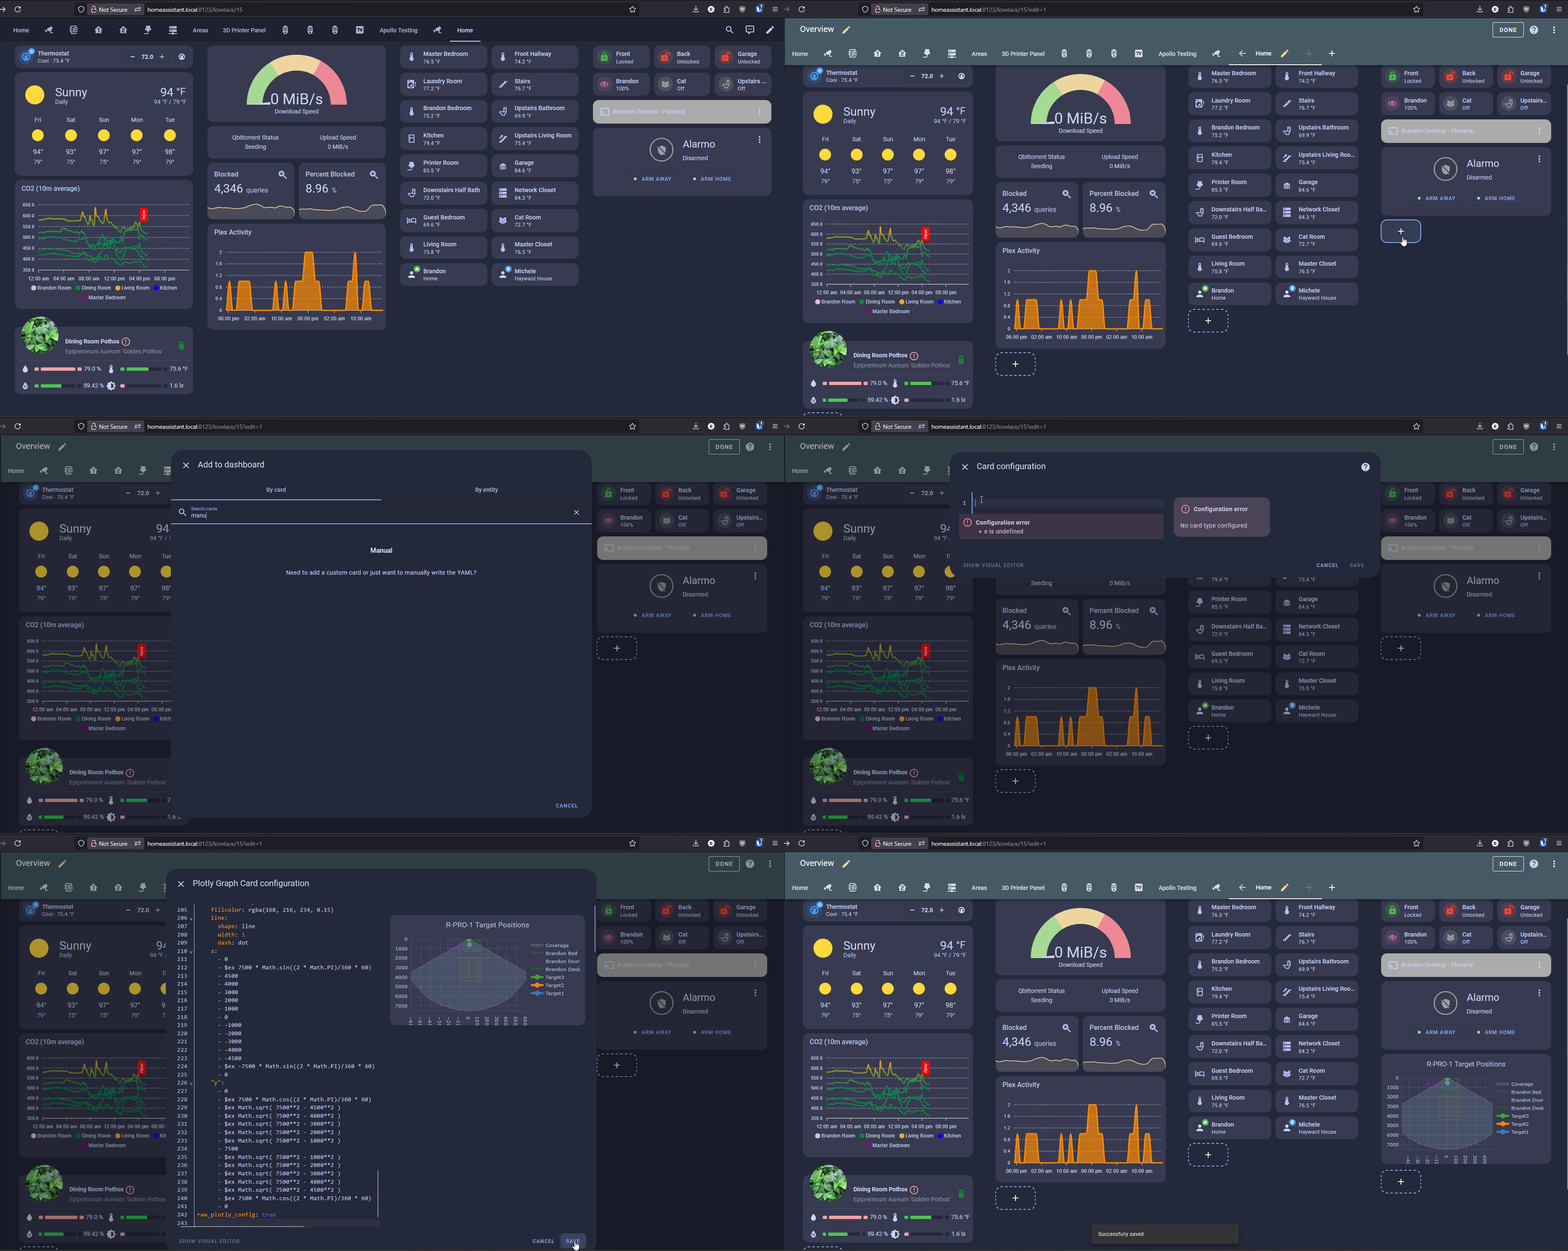
Shown with an R PRO-1 card; the MTR-1 steps are the same.
5. Delete any text in the card, paste the YAML you copied in step 3, and click Save.
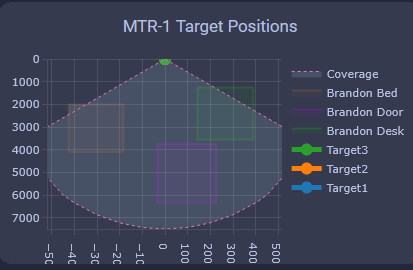
Your dashboard now has a card like the one above, showing the radar's coverage area and your three zones.
Open your MTR-1's device page
The target sensors and zone settings are on your MTR-1's page in the ESPHome integration.
1. Head to the ESPHome Integrations page (Settings → Devices & services → ESPHome).
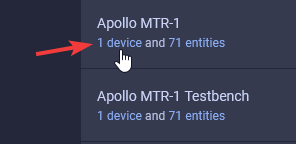
2. Click your device, as shown in the image below.
Switch the target sensors to millimeters (imperial units only)
Metric users can skip this section
If your Home Assistant uses the metric system, go straight to Enter your zones.
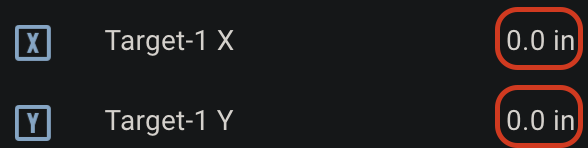
If you use the imperial system, your Target 1-3 X and Y sensors report in inches (in). For the targets to show up correctly on the card, change all three X and all three Y target sensors to millimeters (mm).
1. In the Sensors section, find the Target 1-3 X and Y sensors and select one of them.
2. Select the Settings cog in the top right.
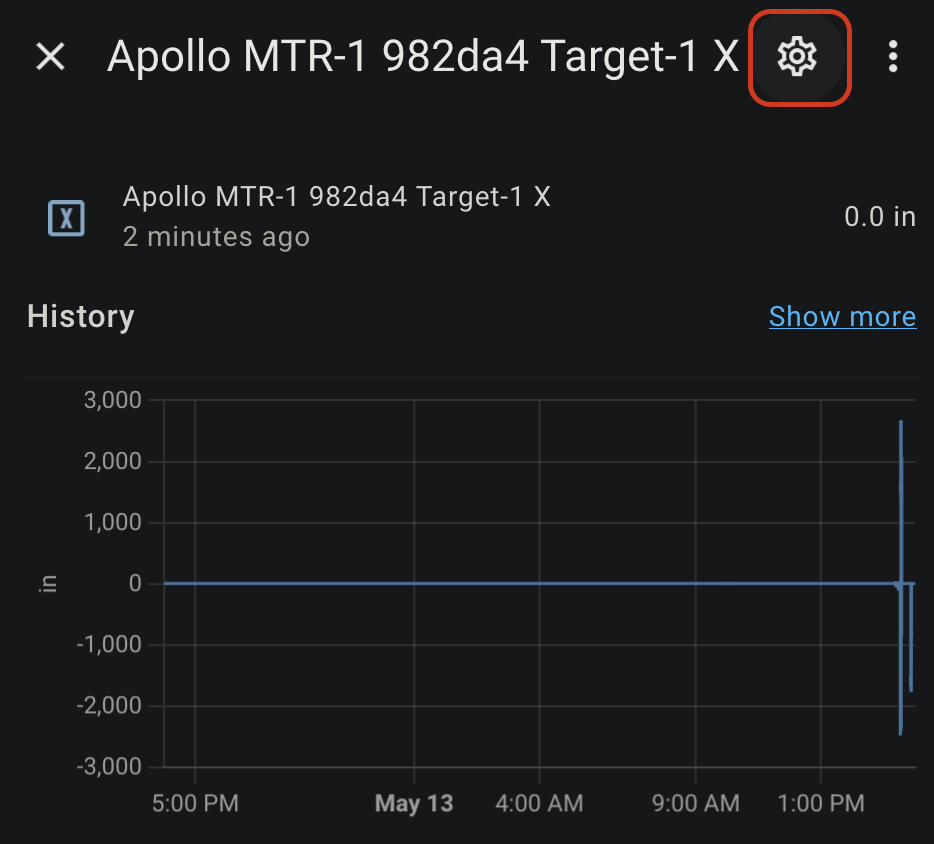
3. Change the unit of measurement to mm and select Update.
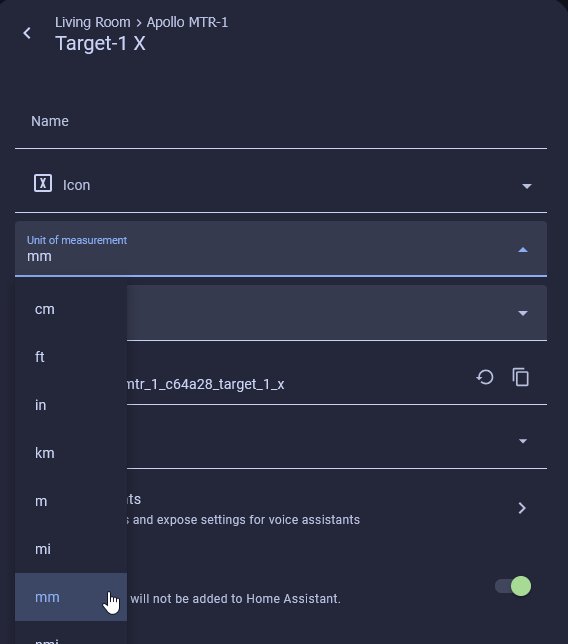
4. Repeat steps 1 to 3 for each of the other target sensors, so all three X and all three Y sensors are updated. Your X and Y targets now look like this.
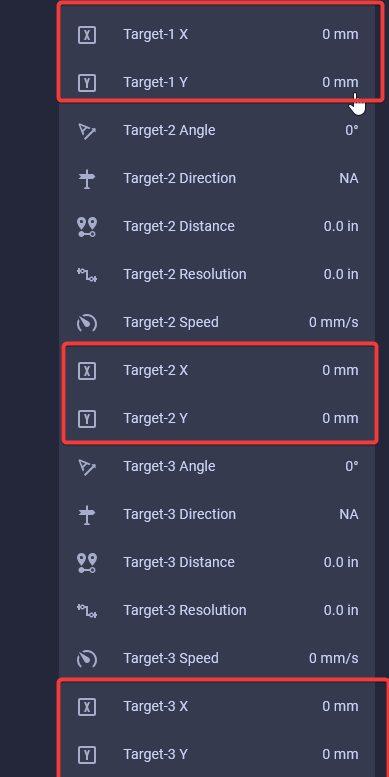
5. Check your Plotly card. Your targets now appear on it.
Your card now shows live targets, so you're ready to draw zones around them.
Enter your zones
Now use the live targets on the card to find the coordinates for each zone, and enter them on your MTR-1's device page.
1. Scroll down to the Configuration section, where you see the empty boxes for the X and Y coordinates of zones 1-3.
Suggested settings
- Turn on Multi Target Tracking to help the MTR-1 detect up to three targets better.
- Zone Type lets you select Disabled, Detection, or Filter:
- Disabled: disables zone area detection.
- Detection: only detects targets in the specified zone.
- Filter: excludes the zone from detection.
2. Walk, sit, or stand in the area where you want a detection or non-detection zone, and watch where your target appears on the card. Then enter the Zone 1-3 X and Y values to draw zones around the targets you want to detect or filter out. X values go from -4860 mm to 4860 mm, and Y values go from 0 mm to 7560 mm.
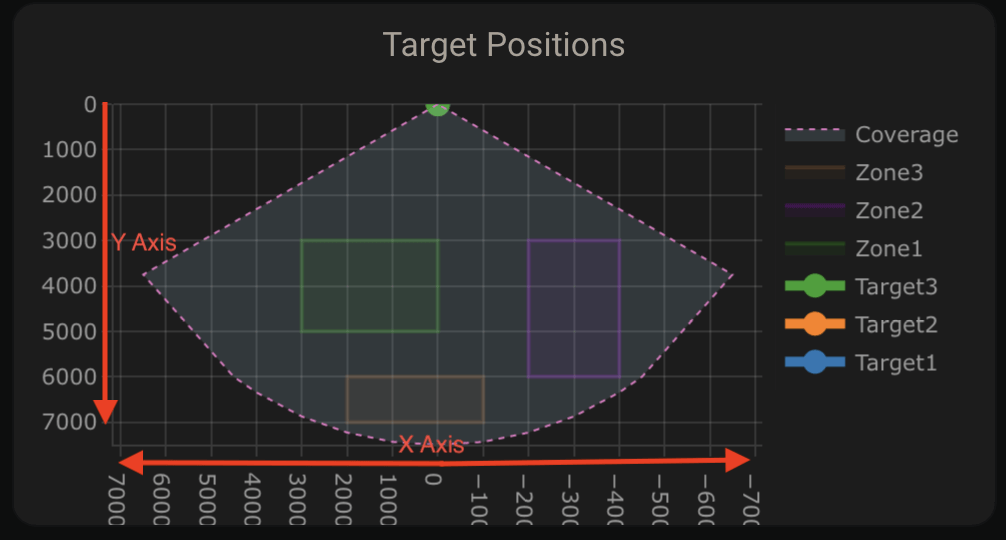
Helpful hints for understanding zones
- X1 must always be less than X2, and Y1 must always be less than Y2.
- The Y axis is simpler, since it's never negative.
- The X axis is where you can get tripped up, especially when both values are negative: -3456 is less than -2345.
- The Plotly chart still draws the rectangles even if the X1/X2 and Y1/Y2 values are reversed, so check the order yourself.
- Zones can't overlap.
Your zones now show on the card, and your MTR-1 uses them to detect or filter out targets.
Zones reset after a restart?
If your zone configurations aren't saved when you restart the device, try turning on LD2450 Bluetooth for a few seconds and then turning it off again. You can also try turning on Multi Target Tracking. This should wake up the mmWave module and retrieve your saved zones.