
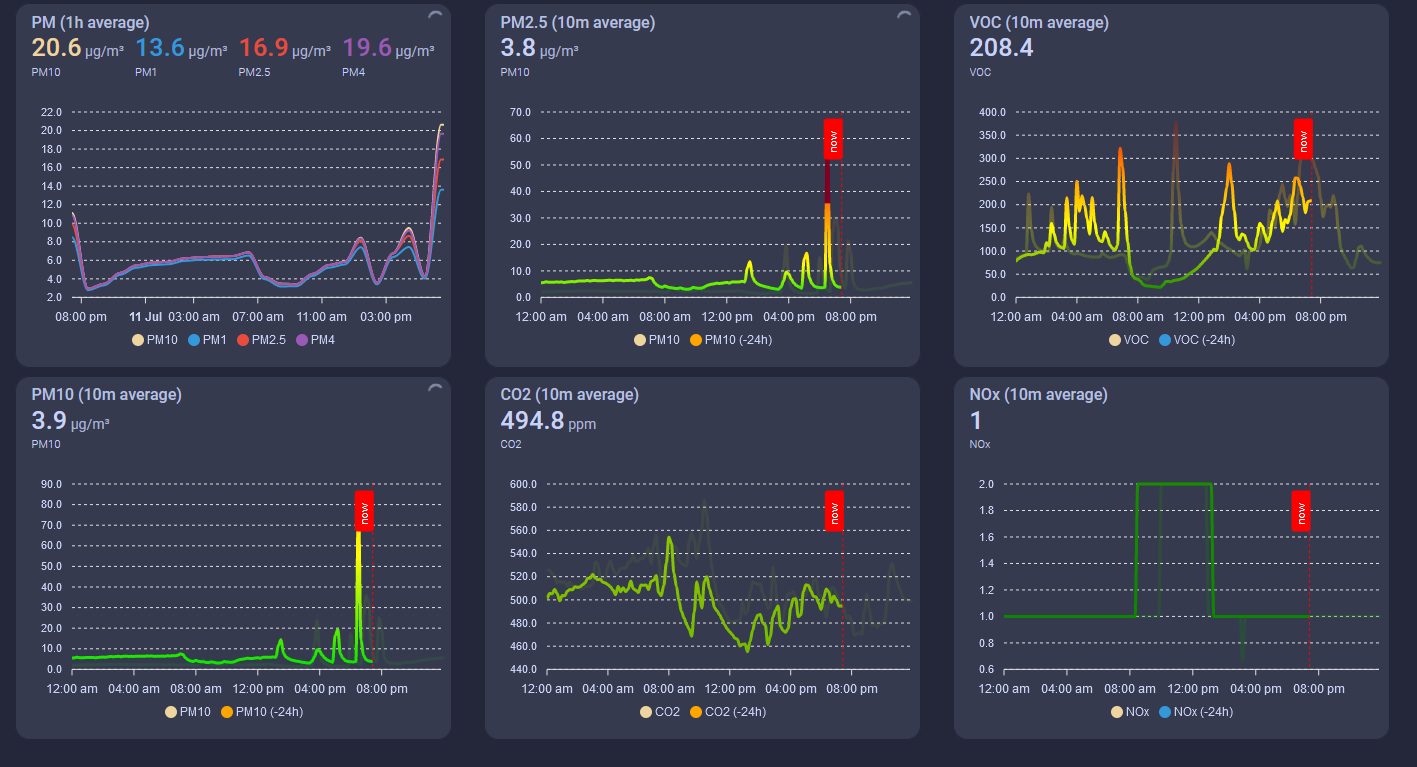
Firstof9's AIR-1 Apex Charts Dashboard
Firstof9 has created this beautiful responsive dashboard with Apexcharts-card custom card from HACS!
The colors will change as severity levels change for each of the sensors below.
This guide assumes you already have HACS installed. If you do not, please first install HACS.
First, you need to install apexcharts-card by going to the HACS tab and searching "apexcharts-card".
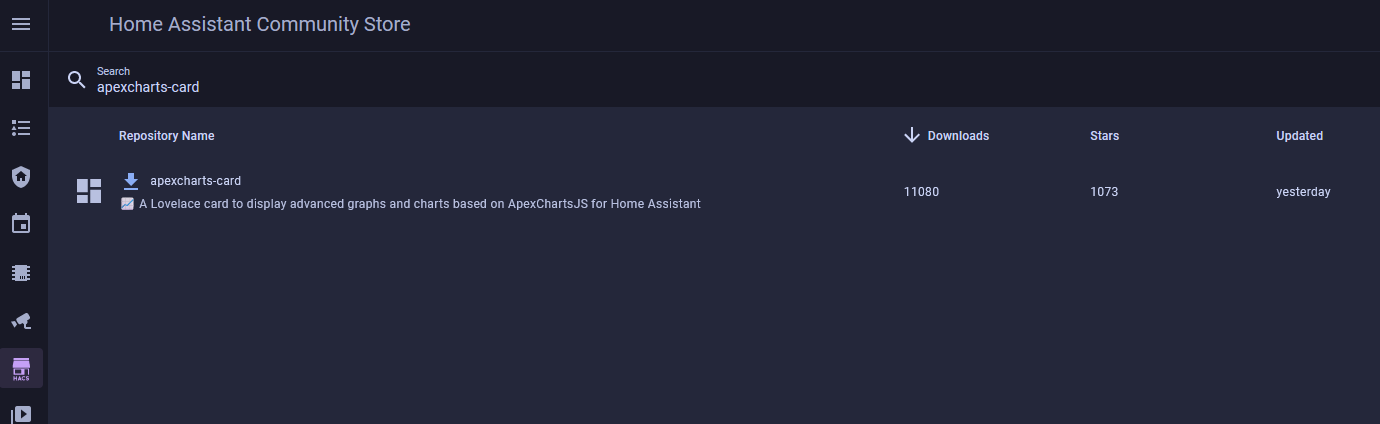
Once downloaded, it is ready to be used for dashboards!
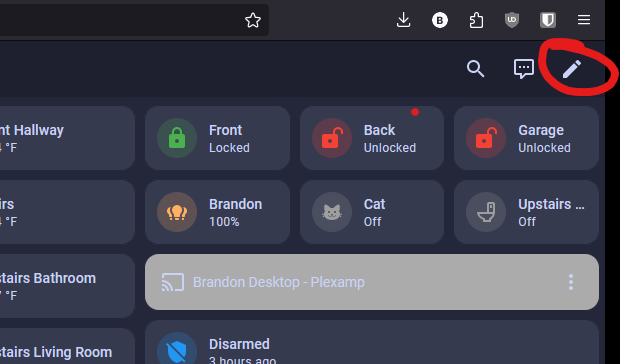
Next, you need to edit the dashboards here.
WARNING YOU ARE ABOUT TO BE ABLE TO WIPE OUT ALL YOUR DASHBOARDS PROCEED WITH CAUTION
WARNING YOU ARE ABOUT TO BE ABLE TO WIPE OUT ALL YOUR DASHBOARDS PROCEED WITH CAUTION
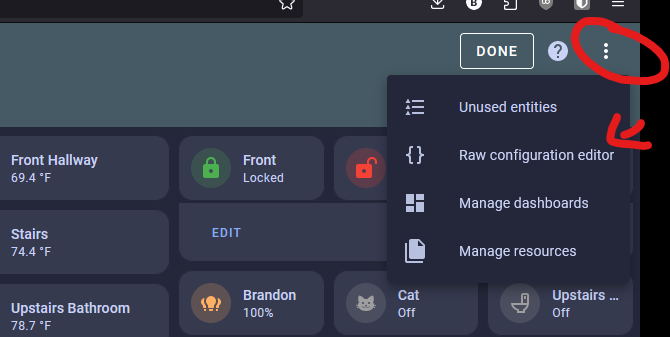
Now choose "raw configuration editor"
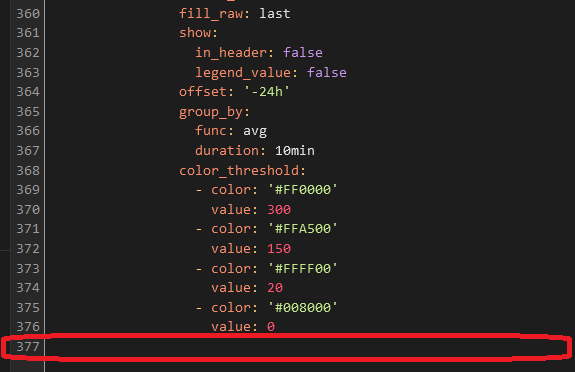
Now you need to be VERY careful. You are editing all of your dashboards but we can avoid issues by scrolling to the very bottom and then copying and pasting the code seen below. (Picture below shows where we will paste the code) (Code below)
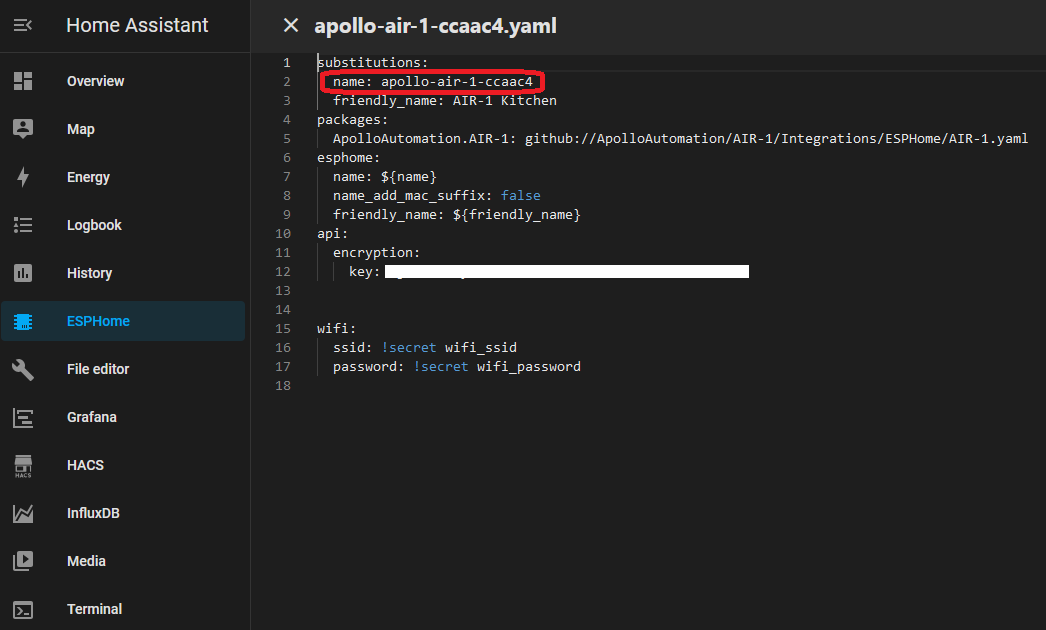
Be sure to change the entity ID to match your device or else the card will not work. You can find your device ID by going to the ESPHome addon and selecting the Edit option.
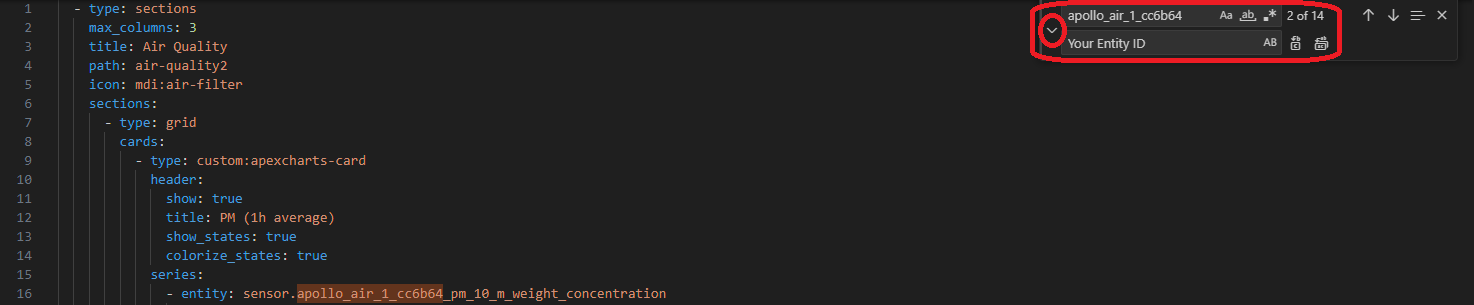
The easiest way to change all of the entity IDs in the code is by using AI (ChatGPT etc.) or by using a code editor like Virtual Studio Code (VSC). In VSC you can Find (ctrl+f) the old ID and Replace (select the small arrow to toggle open the Replace box) it with your ID. Now you are ready to copy the code into the Raw configurator editor. (See code below)
VSC Find/Replace
ChatGPT
This is the code!
- type: sections
max_columns: 3
title: Air Quality
path: air-quality2
icon: mdi:air-filter
sections:
- type: grid
cards:
- type: custom:apexcharts-card
header:
show: true
title: PM (1h average)
show_states: true
colorize_states: true
series:
- entity: sensor.apollo_air_1_cc6b64_pm_10_m_weight_concentration
name: PM10
stroke_width: 2
group_by:
func: avg
duration: 1h
show:
legend_value: false
- entity: sensor.apollo_air_1_cc6b64_pm_1_m_weight_concentration
name: PM1
stroke_width: 2
group_by:
func: avg
duration: 1h
show:
legend_value: false
- entity: sensor.apollo_air_1_cc6b64_pm_2_5_m_weight_concentration
name: PM2.5
stroke_width: 2
group_by:
func: avg
duration: 1h
show:
legend_value: false
- entity: sensor.apollo_air_1_cc6b64_pm_4_m_weight_concentration
name: PM4
stroke_width: 2
group_by:
func: avg
duration: 1h
show:
legend_value: false
- type: custom:apexcharts-card
header:
show: true
title: PM10 (10m average)
show_states: true
colorize_states: false
graph_span: 24h
experimental:
color_threshold: true
span:
start: day
now:
show: true
label: now
color: red
series:
- entity: sensor.apollo_air_1_cc6b64_pm_10_m_weight_concentration
name: PM10
stroke_width: 3
fill_raw: last
extend_to: now
show:
legend_value: false
group_by:
func: avg
duration: 10min
color_threshold:
- color: rgb(126,0,35)
value: 425
- color: rgb(143,63,151)
value: 355
- color: rgb(255,0,0)
value: 255
- color: rgb(255,126,0)
value: 155
- color: rgb(255,255,0)
value: 55
- color: rgb(0,228,0)
value: 0
- entity: sensor.apollo_air_1_cc6b64_pm_10_m_weight_concentration
name: PM10
color: orange
opacity: 0.3
stroke_width: 3
fill_raw: last
show:
in_header: false
legend_value: false
offset: '-24h'
group_by:
func: avg
duration: 10min
color_threshold:
- color: rgb(126,0,35)
value: 425
- color: rgb(143,63,151)
value: 355
- color: rgb(255,0,0)
value: 255
- color: rgb(255,126,0)
value: 155
- color: rgb(255,255,0)
value: 55
- color: rgb(0,228,0)
value: 0
- type: grid
cards:
- type: custom:apexcharts-card
header:
show: true
title: PM2.5 (10m average)
show_states: true
colorize_states: false
graph_span: 24h
experimental:
color_threshold: true
span:
start: day
now:
show: true
label: now
color: red
series:
- entity: sensor.apollo_air_1_cc6b64_pm_2_5_m_weight_concentration
name: PM2.5
stroke_width: 3
fill_raw: last
extend_to: now
show:
legend_value: false
group_by:
func: avg
duration: 10min
color_threshold:
- color: rgb(126,0,35)
value: 35.5
- color: rgb(143,63,151)
value: 35.5
- color: rgb(255,0,0)
value: 35.5
- color: rgb(255,126,0)
value: 35.4
- color: rgb(255,255,0)
value: 12
- color: rgb(0,228,0)
value: 0
- entity: sensor.apollo_air_1_cc6b64_pm_2_5_m_weight_concentration
name: PM2.5
color: orange
opacity: 0.3
stroke_width: 3
fill_raw: last
show:
in_header: false
legend_value: false
offset: '-24h'
group_by:
func: avg
duration: 10min
color_threshold:
- color: rgb(126,0,35)
value: 250.5
- color: rgb(143,63,151)
value: 150.5
- color: rgb(255,0,0)
value: 55.5
- color: rgb(255,126,0)
value: 35.5
- color: rgb(255,255,0)
value: 12.1
- color: rgb(0,228,0)
value: 0
- type: custom:apexcharts-card
header:
show: true
title: CO2 (10m average)
show_states: true
colorize_states: false
graph_span: 24h
experimental:
color_threshold: true
span:
start: day
now:
show: true
label: now
color: red
series:
- entity: sensor.apollo_air_1_cc6b64_co2
name: CO2
stroke_width: 3
fill_raw: last
extend_to: now
show:
legend_value: false
group_by:
func: avg
duration: 10min
color_threshold:
- color: '#FF0000'
value: 5000
- color: '#FFA500'
value: 2000
- color: '#FFFF00'
value: 1000
- color: '#008000'
value: 0
- entity: sensor.apollo_air_1_cc6b64_co2
name: CO2
color: orange
opacity: 0.3
stroke_width: 3
fill_raw: last
show:
in_header: false
legend_value: false
offset: '-24h'
group_by:
func: avg
duration: 10min
color_threshold:
- color: '#FF0000'
value: 5000
- color: '#FFA500'
value: 2000
- color: '#FFFF00'
value: 1000
- color: '#008000'
value: 0
- type: grid
cards:
- type: custom:apexcharts-card
header:
show: true
title: VOC (10m average)
show_states: true
colorize_states: false
experimental:
color_threshold: true
graph_span: 24h
span:
start: day
now:
show: true
label: now
color: red
series:
- entity: sensor.apollo_air_1_cc6b64_sen55_voc
name: VOC
stroke_width: 3
show:
legend_value: false
extend_to: now
fill_raw: last
group_by:
func: avg
duration: 10min
fill: last
color_threshold:
- color: '#FF0000'
value: 400
- color: '#FFA500'
value: 250
- color: '#FFFF00'
value: 150
- color: '#008000'
value: 0
- entity: sensor.apollo_air_1_cc6b64_sen55_voc
name: VOC
opacity: 0.5
stroke_width: 3
fill_raw: last
show:
in_header: false
legend_value: false
offset: '-24h'
group_by:
func: avg
duration: 10min
fill: last
color_threshold:
- color: '#FF0000'
value: 400
- color: '#FFA500'
value: 250
- color: '#FFFF00'
value: 150
- color: '#008000'
value: 0
- type: custom:apexcharts-card
header:
show: true
title: NOx (10m average)
show_states: true
colorize_states: false
experimental:
color_threshold: true
graph_span: 24h
span:
start: day
now:
show: true
label: now
color: red
series:
- entity: sensor.apollo_air_1_cc6b64_sen55_nox
name: NOx
show:
legend_value: false
stroke_width: 3
fill_raw: last
extend_to: now
group_by:
func: avg
duration: 10min
color_threshold:
- color: '#FF0000'
value: 300
- color: '#FFA500'
value: 150
- color: '#FFFF00'
value: 20
- color: '#008000'
value: 0
- entity: sensor.apollo_air_1_cc6b64_sen55_nox
name: NOx
opacity: 0.5
stroke_width: 3
fill_raw: last
show:
in_header: false
legend_value: false
offset: '-24h'
group_by:
func: avg
duration: 10min
color_threshold:
- color: '#FF0000'
value: 300
- color: '#FFA500'
value: 150
- color: '#FFFF00'
value: 20
- color: '#008000'
value: 0If you are using the old masonry-style dashboards, please paste in this code:
  - title: Air Quality
    path: air-quality
    icon: mdi:air-filter
    cards:
      - type: custom:apexcharts-card
        header:
          show: true
          title: PM (1h average)
          show_states: true
          colorize_states: true
        series:
          - entity: sensor.apollo_air_1_cc6b64_pm_10_m_weight_concentration
            name: PM10
            stroke_width: 2
            group_by:
              func: avg
              duration: 1h
            show:
              legend_value: false
          - entity: sensor.apollo_air_1_cc6b64_pm_1_m_weight_concentration
            name: PM1
            stroke_width: 2
            group_by:
              func: avg
              duration: 1h
            show:
              legend_value: false
          - entity: sensor.apollo_air_1_cc6b64_pm_2_5_m_weight_concentration
            name: PM2.5
            stroke_width: 2
            group_by:
              func: avg
              duration: 1h
            show:
              legend_value: false
          - entity: sensor.apollo_air_1_cc6b64_pm_4_m_weight_concentration
            name: PM4
            stroke_width: 2
            group_by:
              func: avg
              duration: 1h
            show:
              legend_value: false
      - type: custom:apexcharts-card
        header:
          show: true
          title: PM10 (10m average)
          show_states: true
          colorize_states: false
        graph_span: 24h
        experimental:
          color_threshold: true
        span:
          start: day
        now:
          show: true
          label: now
          color: red
        series:
          - entity: sensor.apollo_air_1_cc6b64_pm_10_m_weight_concentration
            name: PM10
            stroke_width: 3
            fill_raw: last
            extend_to: now
            show:
              legend_value: false
            group_by:
              func: avg
              duration: 10min
            color_threshold:
              - color: rgb(126,0,35)
                value: 425
              - color: rgb(143,63,151)
                value: 355
              - color: rgb(255,0,0)
                value: 255
              - color: rgb(255,126,0)
                value: 155
              - color: rgb(255,255,0)
                value: 55
              - color: rgb(0,228,0)
                value: 0
          - entity: sensor.apollo_air_1_cc6b64_pm_10_m_weight_concentration
            name: PM10
            color: orange
            opacity: 0.3
            stroke_width: 3
            fill_raw: last
            show:
              in_header: false
              legend_value: false
            offset: '-24h'
            group_by:
              func: avg
              duration: 10min
            color_threshold:
              - color: rgb(126,0,35)
                value: 425
              - color: rgb(143,63,151)
                value: 355
              - color: rgb(255,0,0)
                value: 255
              - color: rgb(255,126,0)
                value: 155
              - color: rgb(255,255,0)
                value: 55
              - color: rgb(0,228,0)
                value: 0
      - type: custom:apexcharts-card
        header:
          show: true
          title: PM2.5 (10m average)
          show_states: true
          colorize_states: false
        graph_span: 24h
        experimental:
          color_threshold: true
        span:
          start: day
        now:
          show: true
          label: now
          color: red
        series:
          - entity: sensor.apollo_air_1_cc6b64_pm_2_5_m_weight_concentration
            name: PM10
            stroke_width: 3
            fill_raw: last
            extend_to: now
            show:
              legend_value: false
            group_by:
              func: avg
              duration: 10min
            color_threshold:
              - color: rgb(126,0,35)
                value: 35.5
              - color: rgb(143,63,151)
                value: 35.5
              - color: rgb(255,0,0)
                value: 35.5
              - color: rgb(255,126,0)
                value: 35.4
              - color: rgb(255,255,0)
                value: 12
              - color: rgb(0,228,0)
                value: 0
          - entity: sensor.apollo_air_1_cc6b64_pm_2_5_m_weight_concentration
            name: PM10
            color: orange
            opacity: 0.3
            stroke_width: 3
            fill_raw: last
            show:
              in_header: false
              legend_value: false
            offset: '-24h'
            group_by:
              func: avg
              duration: 10min
            color_threshold:
              - color: rgb(126,0,35)
                value: 250.5
              - color: rgb(143,63,151)
                value: 150.5
              - color: rgb(255,0,0)
                value: 55.5
              - color: rgb(255,126,0)
                value: 35.5
              - color: rgb(255,255,0)
                value: 12.1
              - color: rgb(0,228,0)
                value: 0
      - type: custom:apexcharts-card
        header:
          show: true
          title: CO2 (10m average)
          show_states: true
          colorize_states: false
        graph_span: 24h
        experimental:
          color_threshold: true
        span:
          start: day
        now:
          show: true
          label: now
          color: red
        series:
          - entity: sensor.apollo_air_1_cc6b64_co2
            name: CO2
            stroke_width: 3
            fill_raw: last
            extend_to: now
            show:
              legend_value: false
            group_by:
              func: avg
              duration: 10min
            color_threshold:
              - color: '#FF0000'
                value: 5000
              - color: '#FFA500'
                value: 2000
              - color: '#FFFF00'
                value: 1000
              - color: '#008000'
                value: 0
          - entity: sensor.apollo_air_1_cc6b64_co2
            name: CO2
            color: orange
            opacity: 0.3
            stroke_width: 3
            fill_raw: last
            show:
              in_header: false
              legend_value: false
            offset: '-24h'
            group_by:
              func: avg
              duration: 10min
            color_threshold:
              - color: '#FF0000'
                value: 5000
              - color: '#FFA500'
                value: 2000
              - color: '#FFFF00'
                value: 1000
              - color: '#008000'
                value: 0
      - type: custom:apexcharts-card
        header:
          show: true
          title: VOC (10m average)
          show_states: true
          colorize_states: false
        experimental:
          color_threshold: true
        graph_span: 24h
        span:
          start: day
        now:
          show: true
          label: now
          color: red
        series:
          - entity: sensor.apollo_air_1_cc6b64_sen55_voc
            name: VOC
            stroke_width: 3
            show:
              legend_value: false
            extend_to: now
            fill_raw: last
            group_by:
              func: avg
              duration: 10min
              fill: last
            color_threshold:
              - color: '#FF0000'
                value: 400
              - color: '#FFA500'
                value: 250
              - color: '#FFFF00'
                value: 150
              - color: '#008000'
                value: 0
          - entity: sensor.apollo_air_1_cc6b64_sen55_voc
            name: VOC
            opacity: 0.5
            stroke_width: 3
            fill_raw: last
            show:
              in_header: false
              legend_value: false
            offset: '-24h'
            group_by:
              func: avg
              duration: 10min
              fill: last
            color_threshold:
              - color: '#FF0000'
                value: 400
              - color: '#FFA500'
                value: 250
              - color: '#FFFF00'
                value: 150
              - color: '#008000'
                value: 0
      - type: custom:apexcharts-card
        header:
          show: true
          title: NOx (10m average)
          show_states: true
          colorize_states: false
        experimental:
          color_threshold: true
        graph_span: 24h
        span:
          start: day
        now:
          show: true
          label: now
          color: red
        series:
          - entity: sensor.apollo_air_1_cc6b64_sen55_nox
            name: NOx
            show:
              legend_value: false
            stroke_width: 3
            fill_raw: last
            extend_to: now
            group_by:
              func: avg
              duration: 10min
            color_threshold:
              - color: '#FF0000'
                value: 300
              - color: '#FFA500'
                value: 150
              - color: '#FFFF00'
                value: 20
              - color: '#008000'
                value: 0
          - entity: sensor.apollo_air_1_cc6b64_sen55_nox
            name: NOx
            opacity: 0.5
            stroke_width: 3
            fill_raw: last
            show:
              in_header: false
              legend_value: false
            offset: '-24h'
            group_by:
              func: avg
              duration: 10min
            color_threshold:
              - color: '#FF0000'
                value: 300
              - color: '#FFA500'
                value: 150
              - color: '#FFFF00'
                value: 20
              - color: '#008000'
                value: 0
Now click save in the top right and remember to not hit any buttons or make any other edits before saving!
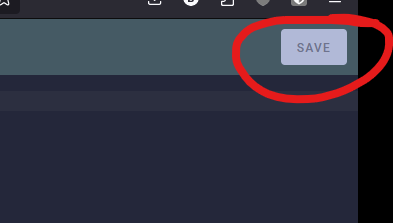
Finally hit "done" in the top right.

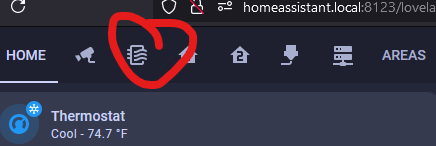
Hit F5 on your keyboard or refresh your browser and then look for your new "Air Icon" as a new dashboard option and click on it!
Lastly, we do want to thank firstof9 for creating this dashboard and sharing it.
No Comments