Examples
- AIR-1 Home Assistant Dashboard Examples
- How To Use The Apollo GPIO Header To Control An LED Strip
- Firstof9's AIR-1 Apex Charts Dashboard
AIR-1 Home Assistant Dashboard Examples
CO2 Charts
Home Assistant Sensor

graph: line
type: sensor
entity: sensor.apollo_air_1_a79e38_co2
detail: 2
name: Bedroom CO2
hours_to_show: 24
Custom: Plotly Graph Card

type: custom:plotly-graph
entities:
  - entity: sensor.apollo_air_1_a79e38_co2
hours_to_show: 24
refresh_interval: 10
title: Bedroom CO2
Home Assistant Guage

type: gauge
entity: sensor.apollo_air_1_a79e38_co2
needle: true
unit: ppm
min: 0
max: 3000
severity:
  green: 0
  yellow: 1000
  red: 2000
VOC Charts
Home Assistant Sensor

graph: line
type: sensor
detail: 2
entity: sensor.apollo_air_1_6b1a58_sen55_voc
hours_to_show: 24
name: Basement VOC
Custom: Plotly Graph Card

type: custom:plotly-graph
entities:
  - entity: sensor.apollo_air_1_6b1a58_sen55_voc
hours_to_show: 24
refresh_interval: 10
title: Basement VOC
Home Assistant Guage

type: gauge
entity: sensor.apollo_air_1_6b1a58_sen55_voc
name: Basement VOC
severity:
  green: 0
  yellow: 150
  red: 350
needle: true
min: 0
max: 500
How To Use The Apollo GPIO Header To Control An LED Strip
This tutorial will guide you through setting up one of our MSR-2 devices (works with any mezzanine port on any Apollo Device) with the optional $4.99 GPIO Header which adds pins for you to easily add functionality to your device! In this tutorial, however, we will be focusing on adding an LED strip to your Apollo device.
Materials Needed for tutorial:
- Apollo MSR-2, Apollo MTR-1, and all other future Apollo Automation products with the mezzanine port.
- Apollo GPIO Header
- ws2812b aka neopixel RGB led strip or similar. sk6812 RGBW strip will also work.
- Optional DuPont Cables for GPIO Header but any DuPont cables will do.
- USB-C cable and power brick to power MSR-2
You are limited to 300mA of power output from the 5v port. You can either attach an external power supply and power the MSR-2 via 5v and gnd pins or work with the limited power output of the port

Above is an image of the GPIO Header and its pinouts. We can use ports 2,4,6,7 for our data channel to an LED strip or multiple LED strips. We will also use the top two ports which are ground and 5v for power.
Did you know you can power the esp32 from the 5v and gnd pin? That means you can connect an external power supply and power it without the side USB port being used! This also allows for more power to be given to your LEDs!
We cannot use the IO ports 0,1,18, or 19 for LEDs but you can use ports 0 and 1 for i2c sensors.
Connecting the GPIO Header to the MSR-2
The first thing we will do is remove our MSR-2 back plate and connect our GPIO Header to our MSR-2 and then put the new GPIO back plate on (blue).
Step 1. Remove the backplate of the MSR-2


Step 2. Line up the Xs shown on the msr-2 and the GPIO Header. They should both be facing in the same direction as shown below.

Step 3. Gently push down onto the GPIO Header as shown below:

Step 4. Confirm the GPIO Header is seated properly as shown below.

Step 5. Slide the GPIO Header back plate for the MSR-2 over your sensor and gently push down until it clicks into place.

If the back plate does not gently go onto the sensor please investigate and confirm it is in the right orientation.
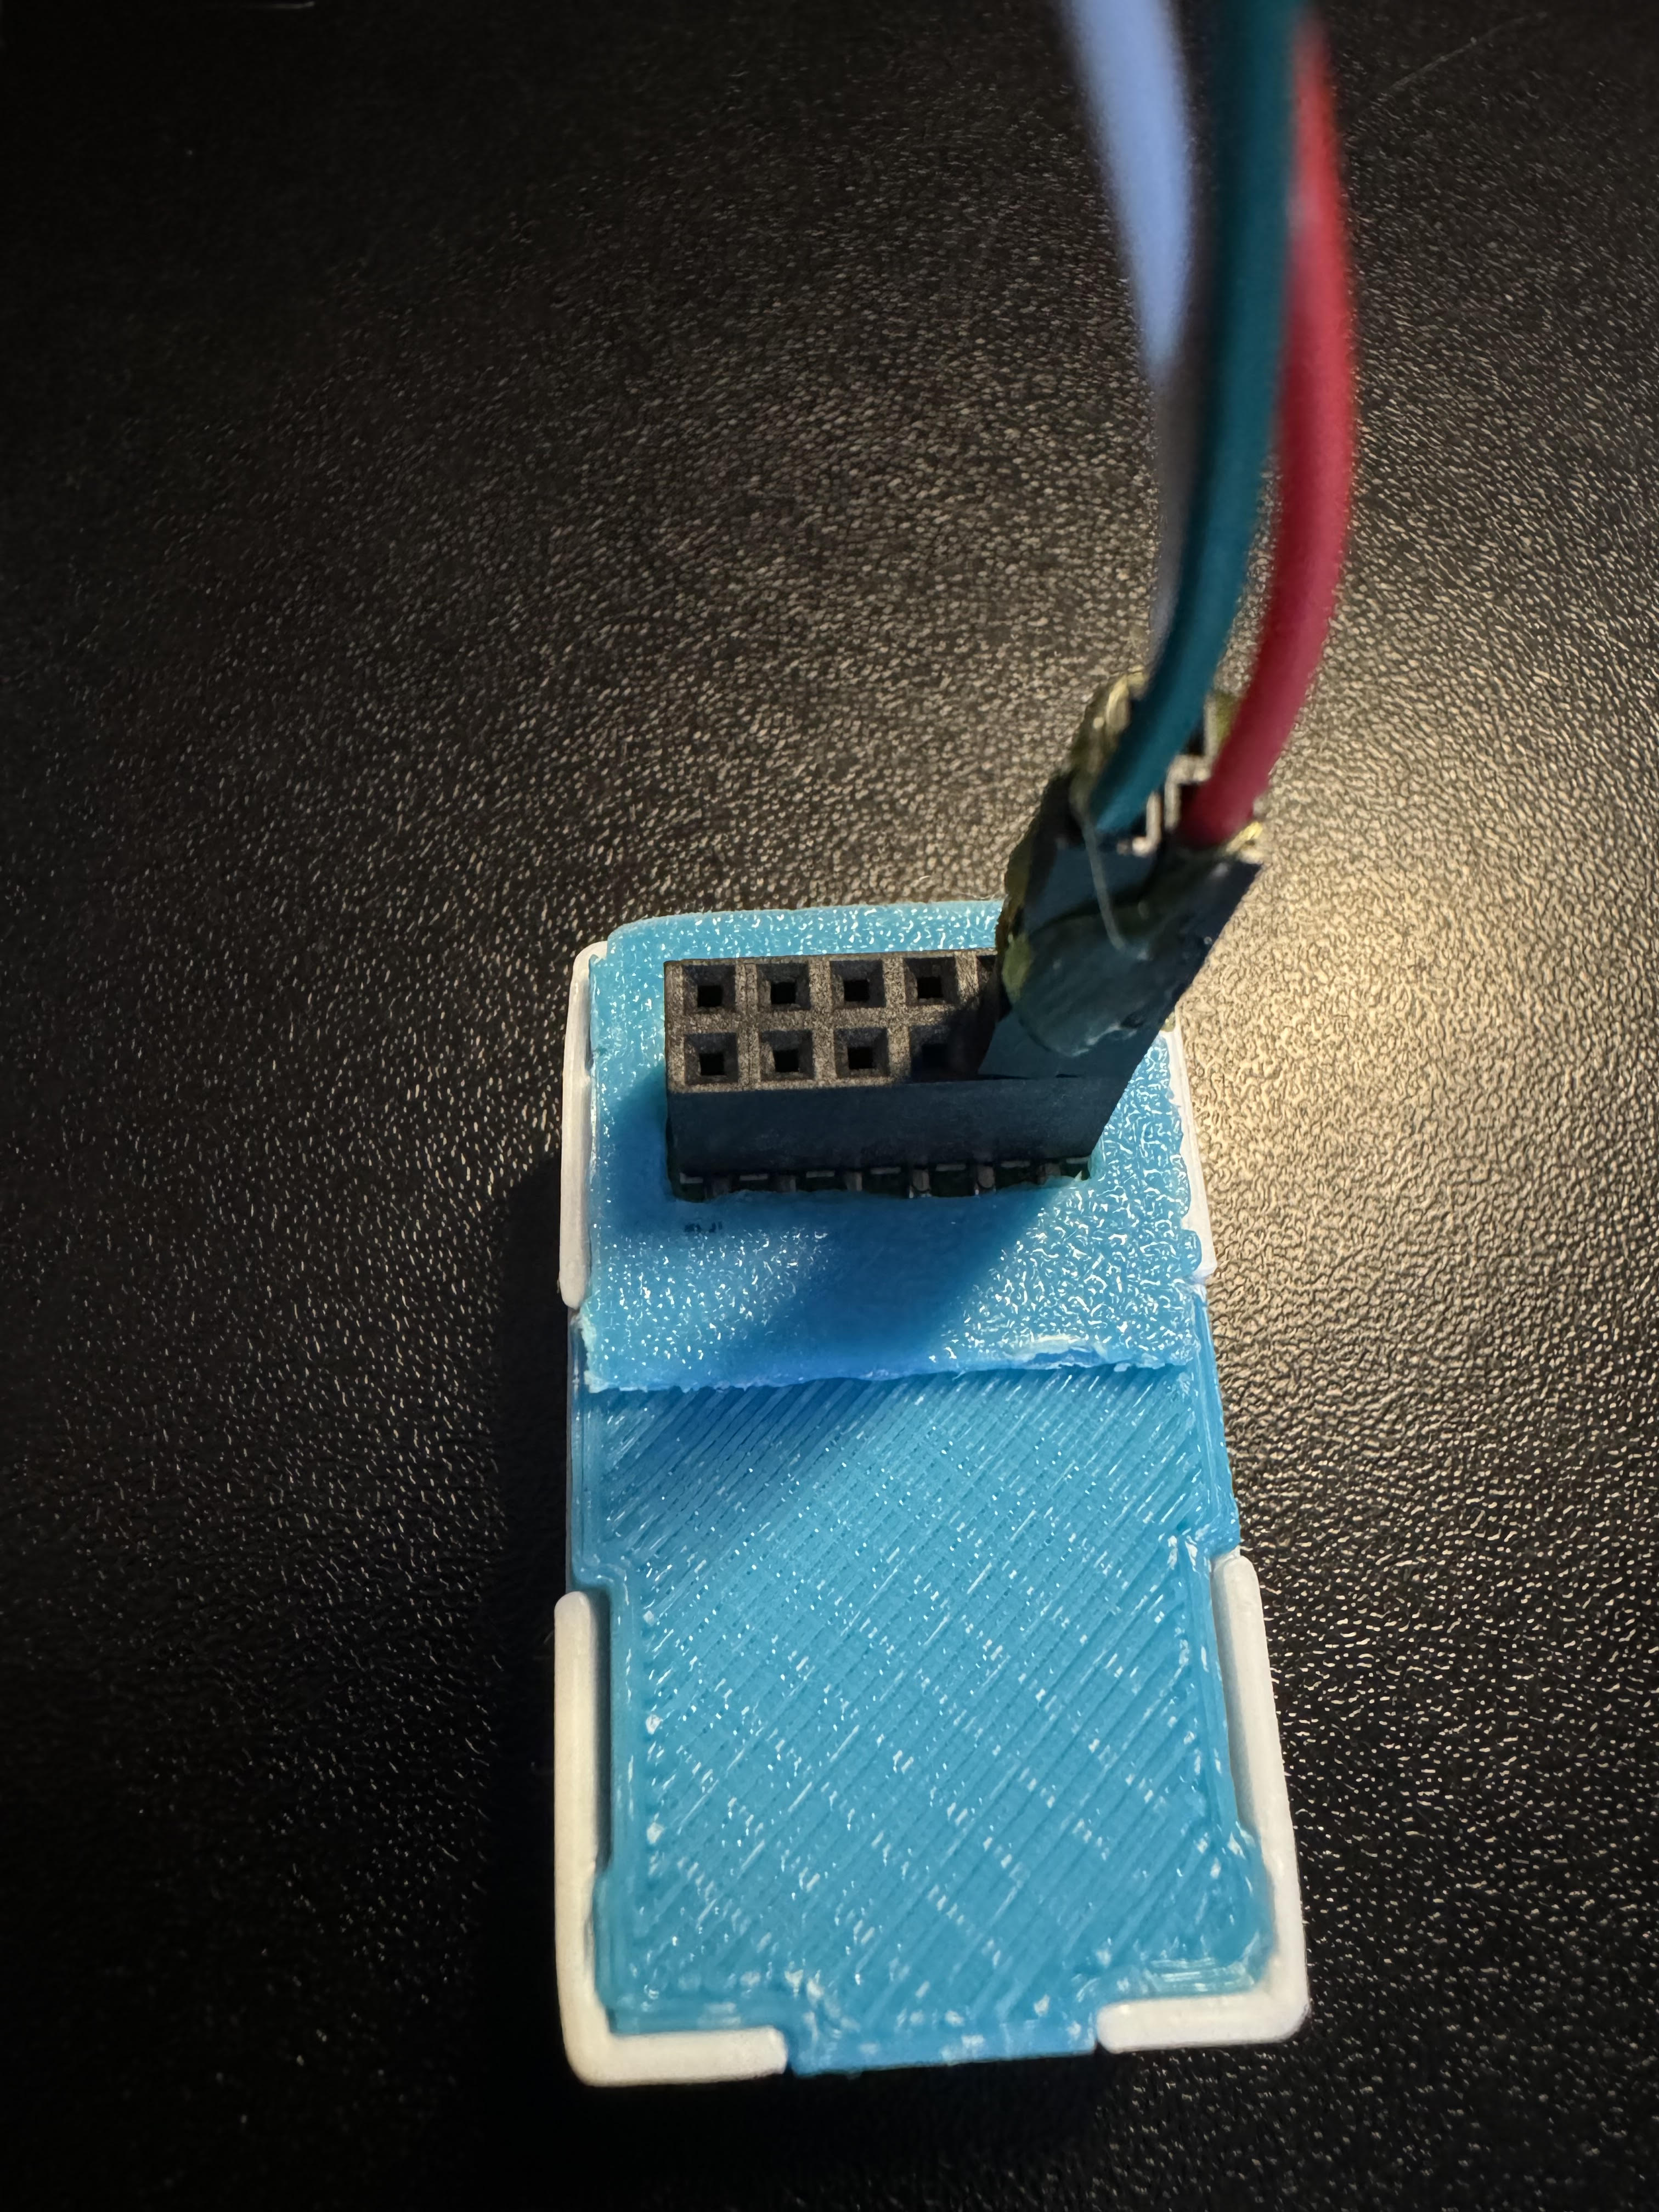
Connecting DuPont pins to proper GPIO ports
Now we need to reference the GPIO pinout we looked at above and then connect three wires. You will need three male-to-male DuPont wires included in your kit. I suggest using red for power aka 5v, White for ground aka GND, and green for data aka port IO7. Most LED strips will also have this same color scheme and it's easier to match like colors together.


You can add a bit of hot glue to the Dupont wires to hold them together. DO NOT put hot glue into the GPIO Header's female pins that will ruin the addon. I am only suggesting that you can hot-glue the Dupont pins outer shell themselves together to stiffen them up.
Connecting DuPont pins to LED Strip
Next, we need to connect the other side of the Dupont pins to the LED strip. Most likely your LED strip will have a JST-SM connector which is a 3amp max connector with three wires connected: red for 5v, green for data, and white for gnd. We will be matching up our red, green, and white wires already attached to the GPIO add-on pins in the MSR-2 (using IO7 as the data pin for this tutorial)


Make sure to connect to the correct side of the LED strip. The led strip will have an arrow going down the led strip showing one direction for the data line. you want the data channel going FROM the msr-2 TO the led strip going in a "forward" direction as shown below.


Edit the YAML of your MSR-2 to let it know about your new LED strip
Finally, we need to tell the MSR-2 that we connected an LED strip. We need to tell it how many LEDs we have and we need to tell it that it's our second LED since the built-in LED is the first. This tutorial assumes you are comfortable with the ESPHome dashboard.
Step 1. Open ESPhome Dashboard and click edit to bring up the yaml your sensor is currently using.

You will see some YAML code here and you do NOT want to touch anything above line 20. If you need to, click your cursor at the end of wifi_password and hit enter to create a new line then make sure you backspace until you are "flush" with the line numbers like how wifi: is.
Step 2. Copy the code below and paste it to line 20 in your ESPHome yaml for this device.
light:
  - platform: esp32_rmt_led_strip
    id: bed_led
    name: "Bed LED"
    pin: GPIO7
    rmt_channel: 1
    default_transition_length: 0s
    chipset: WS2812
    num_leds: 60
    rgb_order: grb
    effects:
      - pulse:
          name: "Slow Pulse"
          transition_length: 1000ms
          update_interval: 1000ms
          min_brightness: 50%
          max_brightness: 100%
      - pulse:
          name: "Fast Pulse"
          transition_length: 100ms
          update_interval: 100ms
          min_brightness: 50%
          max_brightness: 100%
      - addressable_rainbow:

You change the rmt_channel to 1 because 0 is being used by the built-in LED of the MSR-2.
Step 5. Go into home assistant and confirm you now have a new light entity called Bed LED

Step 6. Click on the name "Bed LED" circled and it will pop up a color picker. You can then choose the color wheel option to pick any color of the rainbow, or select "effect" and choose an effect.


That's all folks! Thanks to Smart Home Sellout for putting this tutorial together!
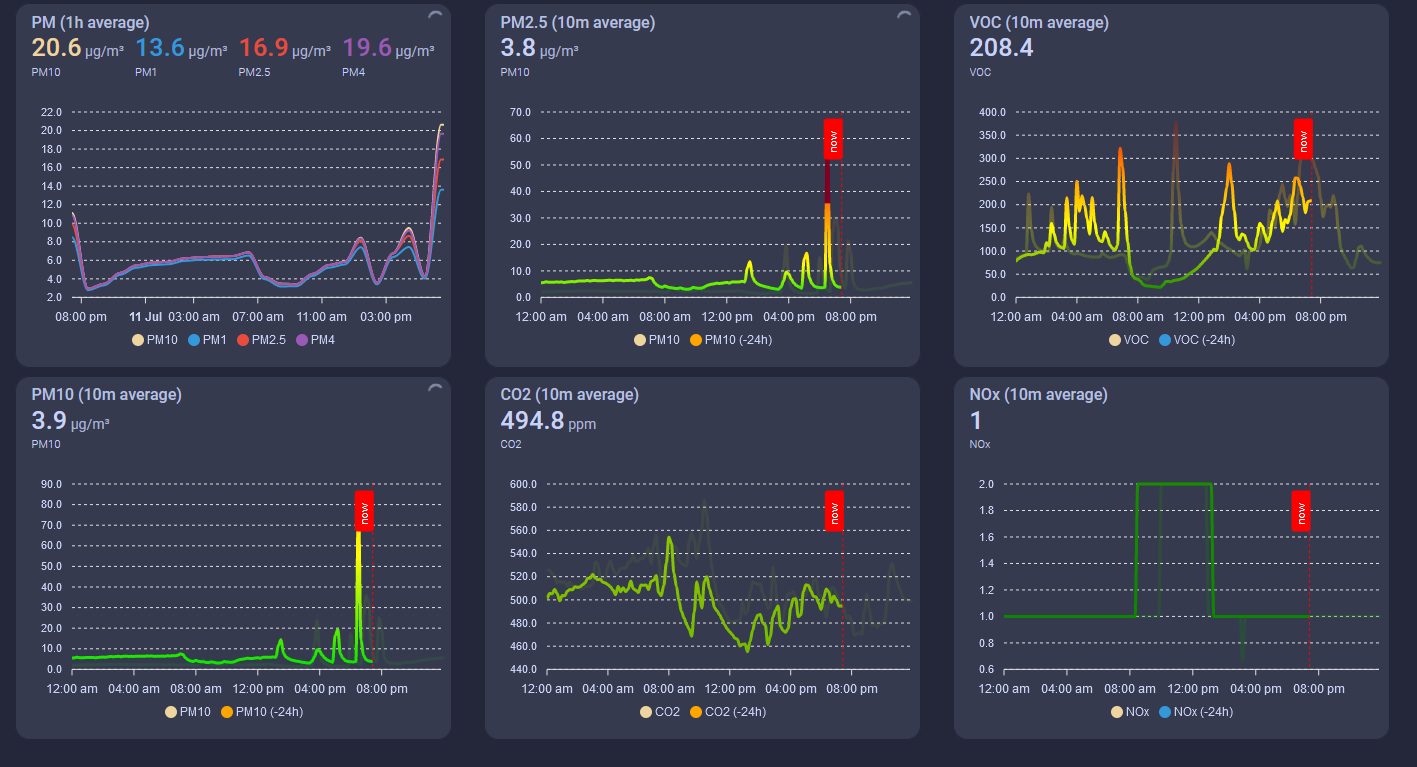
Firstof9's AIR-1 Apex Charts Dashboard
Firstof9 has created this beautiful responsive dashboard with Apexcharts-card custom card from HACS!
The colors will change as severity levels change for each of the sensors below.
This guide assumes you already have HACS installed. If you do not, please first install HACS.
First, you need to install apexcharts-card by going to the HACS tab and searching "apexcharts-card".
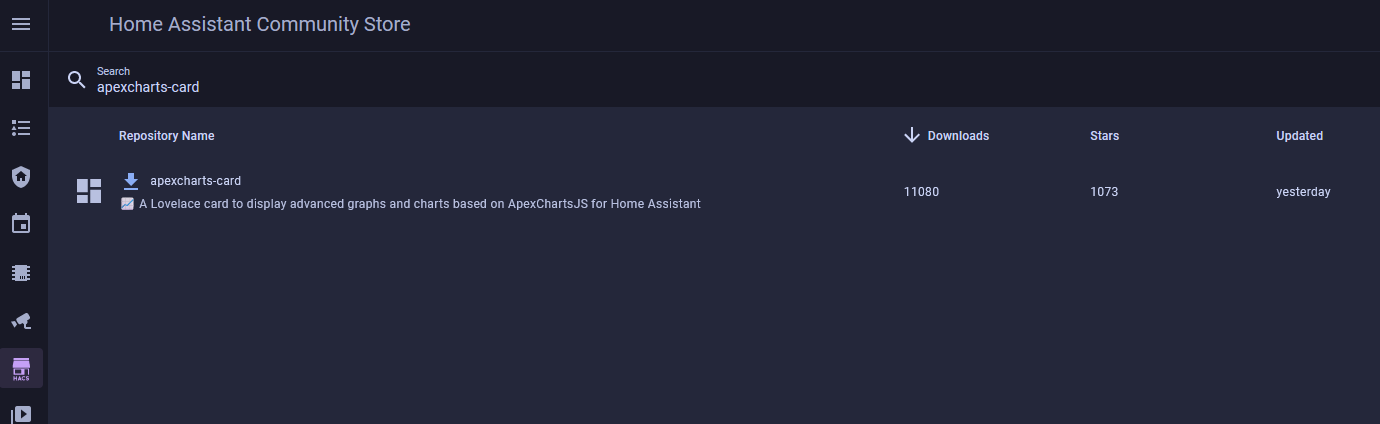
Once downloaded, it is ready to be used for dashboards!
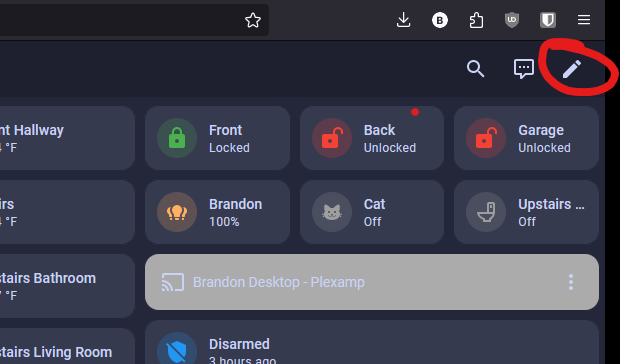
Next, you need to edit the dashboards here.
WARNING YOU ARE ABOUT TO BE ABLE TO WIPE OUT ALL YOUR DASHBOARDS PROCEED WITH CAUTION
WARNING YOU ARE ABOUT TO BE ABLE TO WIPE OUT ALL YOUR DASHBOARDS PROCEED WITH CAUTION
Now choose "raw configuration editor"
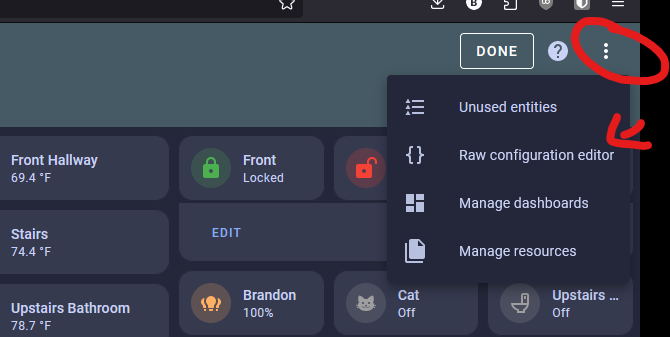
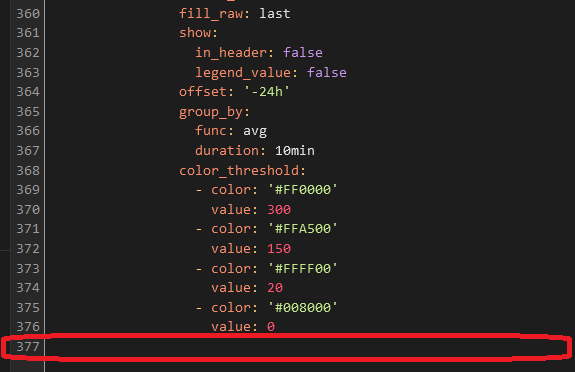
Now you need to be VERY careful. You are editing all of your dashboards but we can avoid issues by scrolling to the very bottom and then copying and pasting the code seen below. (Picture below shows where we will paste the code) (Code below)
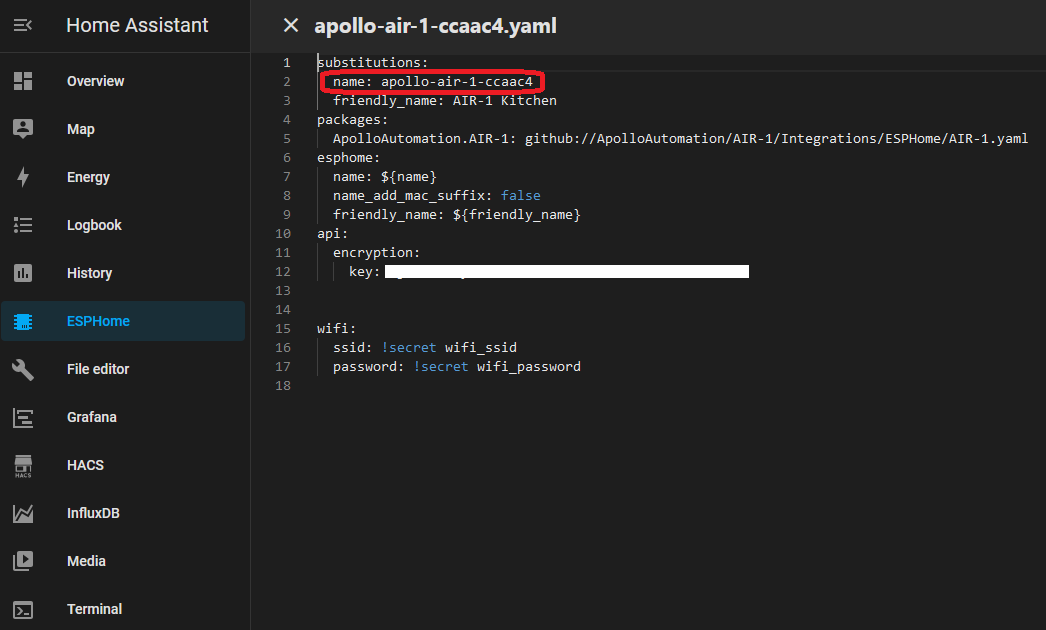
Be sure to change the entity ID to match your device or else the card will not work. You can find your device ID by going to the ESPHome addon and selecting the Edit option.
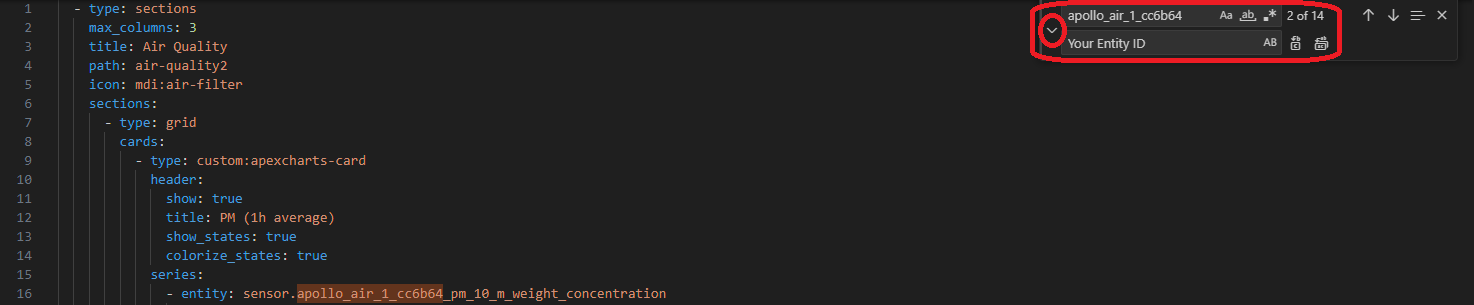
The easiest way to change all of the entity IDs in the code is by using AI (ChatGPT etc.) or by using a code editor like Virtual Studio Code (VSC). In VSC you can Find (ctrl+f) the old ID and Replace (select the small arrow to toggle open the Replace box) it with your ID. Now you are ready to copy the code into the Raw configurator editor. (See code below)
VSC Find/Replace
ChatGPT
This is the code!
- type: sections
max_columns: 3
title: Air Quality
path: air-quality2
icon: mdi:air-filter
sections:
- type: grid
cards:
- type: custom:apexcharts-card
header:
show: true
title: PM (1h average)
show_states: true
colorize_states: true
series:
- entity: sensor.apollo_air_1_cc6b64_pm_10_m_weight_concentration
name: PM10
stroke_width: 2
group_by:
func: avg
duration: 1h
show:
legend_value: false
- entity: sensor.apollo_air_1_cc6b64_pm_1_m_weight_concentration
name: PM1
stroke_width: 2
group_by:
func: avg
duration: 1h
show:
legend_value: false
- entity: sensor.apollo_air_1_cc6b64_pm_2_5_m_weight_concentration
name: PM2.5
stroke_width: 2
group_by:
func: avg
duration: 1h
show:
legend_value: false
- entity: sensor.apollo_air_1_cc6b64_pm_4_m_weight_concentration
name: PM4
stroke_width: 2
group_by:
func: avg
duration: 1h
show:
legend_value: false
- type: custom:apexcharts-card
header:
show: true
title: PM10 (10m average)
show_states: true
colorize_states: false
graph_span: 24h
experimental:
color_threshold: true
span:
start: day
now:
show: true
label: now
color: red
series:
- entity: sensor.apollo_air_1_cc6b64_pm_10_m_weight_concentration
name: PM10
stroke_width: 3
fill_raw: last
extend_to: now
show:
legend_value: false
group_by:
func: avg
duration: 10min
color_threshold:
- color: rgb(126,0,35)
value: 425
- color: rgb(143,63,151)
value: 355
- color: rgb(255,0,0)
value: 255
- color: rgb(255,126,0)
value: 155
- color: rgb(255,255,0)
value: 55
- color: rgb(0,228,0)
value: 0
- entity: sensor.apollo_air_1_cc6b64_pm_10_m_weight_concentration
name: PM10
color: orange
opacity: 0.3
stroke_width: 3
fill_raw: last
show:
in_header: false
legend_value: false
offset: '-24h'
group_by:
func: avg
duration: 10min
color_threshold:
- color: rgb(126,0,35)
value: 425
- color: rgb(143,63,151)
value: 355
- color: rgb(255,0,0)
value: 255
- color: rgb(255,126,0)
value: 155
- color: rgb(255,255,0)
value: 55
- color: rgb(0,228,0)
value: 0
- type: grid
cards:
- type: custom:apexcharts-card
header:
show: true
title: PM2.5 (10m average)
show_states: true
colorize_states: false
graph_span: 24h
experimental:
color_threshold: true
span:
start: day
now:
show: true
label: now
color: red
series:
- entity: sensor.apollo_air_1_cc6b64_pm_2_5_m_weight_concentration
name: PM2.5
stroke_width: 3
fill_raw: last
extend_to: now
show:
legend_value: false
group_by:
func: avg
duration: 10min
color_threshold:
- color: rgb(126,0,35)
value: 35.5
- color: rgb(143,63,151)
value: 35.5
- color: rgb(255,0,0)
value: 35.5
- color: rgb(255,126,0)
value: 35.4
- color: rgb(255,255,0)
value: 12
- color: rgb(0,228,0)
value: 0
- entity: sensor.apollo_air_1_cc6b64_pm_2_5_m_weight_concentration
name: PM2.5
color: orange
opacity: 0.3
stroke_width: 3
fill_raw: last
show:
in_header: false
legend_value: false
offset: '-24h'
group_by:
func: avg
duration: 10min
color_threshold:
- color: rgb(126,0,35)
value: 250.5
- color: rgb(143,63,151)
value: 150.5
- color: rgb(255,0,0)
value: 55.5
- color: rgb(255,126,0)
value: 35.5
- color: rgb(255,255,0)
value: 12.1
- color: rgb(0,228,0)
value: 0
- type: custom:apexcharts-card
header:
show: true
title: CO2 (10m average)
show_states: true
colorize_states: false
graph_span: 24h
experimental:
color_threshold: true
span:
start: day
now:
show: true
label: now
color: red
series:
- entity: sensor.apollo_air_1_cc6b64_co2
name: CO2
stroke_width: 3
fill_raw: last
extend_to: now
show:
legend_value: false
group_by:
func: avg
duration: 10min
color_threshold:
- color: '#FF0000'
value: 5000
- color: '#FFA500'
value: 2000
- color: '#FFFF00'
value: 1000
- color: '#008000'
value: 0
- entity: sensor.apollo_air_1_cc6b64_co2
name: CO2
color: orange
opacity: 0.3
stroke_width: 3
fill_raw: last
show:
in_header: false
legend_value: false
offset: '-24h'
group_by:
func: avg
duration: 10min
color_threshold:
- color: '#FF0000'
value: 5000
- color: '#FFA500'
value: 2000
- color: '#FFFF00'
value: 1000
- color: '#008000'
value: 0
- type: grid
cards:
- type: custom:apexcharts-card
header:
show: true
title: VOC (10m average)
show_states: true
colorize_states: false
experimental:
color_threshold: true
graph_span: 24h
span:
start: day
now:
show: true
label: now
color: red
series:
- entity: sensor.apollo_air_1_cc6b64_sen55_voc
name: VOC
stroke_width: 3
show:
legend_value: false
extend_to: now
fill_raw: last
group_by:
func: avg
duration: 10min
fill: last
color_threshold:
- color: '#FF0000'
value: 400
- color: '#FFA500'
value: 250
- color: '#FFFF00'
value: 150
- color: '#008000'
value: 0
- entity: sensor.apollo_air_1_cc6b64_sen55_voc
name: VOC
opacity: 0.5
stroke_width: 3
fill_raw: last
show:
in_header: false
legend_value: false
offset: '-24h'
group_by:
func: avg
duration: 10min
fill: last
color_threshold:
- color: '#FF0000'
value: 400
- color: '#FFA500'
value: 250
- color: '#FFFF00'
value: 150
- color: '#008000'
value: 0
- type: custom:apexcharts-card
header:
show: true
title: NOx (10m average)
show_states: true
colorize_states: false
experimental:
color_threshold: true
graph_span: 24h
span:
start: day
now:
show: true
label: now
color: red
series:
- entity: sensor.apollo_air_1_cc6b64_sen55_nox
name: NOx
show:
legend_value: false
stroke_width: 3
fill_raw: last
extend_to: now
group_by:
func: avg
duration: 10min
color_threshold:
- color: '#FF0000'
value: 300
- color: '#FFA500'
value: 150
- color: '#FFFF00'
value: 20
- color: '#008000'
value: 0
- entity: sensor.apollo_air_1_cc6b64_sen55_nox
name: NOx
opacity: 0.5
stroke_width: 3
fill_raw: last
show:
in_header: false
legend_value: false
offset: '-24h'
group_by:
func: avg
duration: 10min
color_threshold:
- color: '#FF0000'
value: 300
- color: '#FFA500'
value: 150
- color: '#FFFF00'
value: 20
- color: '#008000'
value: 0If you are using the old masonry-style dashboards, please paste in this code:
- title: Air Quality
path: air-quality
icon: mdi:air-filter
cards:
- type: custom:apexcharts-card
header:
show: true
title: PM (1h average)
show_states: true
colorize_states: true
series:
- entity: sensor.apollo_air_1_cc6b64_pm_10_m_weight_concentration
name: PM10
stroke_width: 2
group_by:
func: avg
duration: 1h
show:
legend_value: false
- entity: sensor.apollo_air_1_cc6b64_pm_1_m_weight_concentration
name: PM1
stroke_width: 2
group_by:
func: avg
duration: 1h
show:
legend_value: false
- entity: sensor.apollo_air_1_cc6b64_pm_2_5_m_weight_concentration
name: PM2.5
stroke_width: 2
group_by:
func: avg
duration: 1h
show:
legend_value: false
- entity: sensor.apollo_air_1_cc6b64_pm_4_m_weight_concentration
name: PM4
stroke_width: 2
group_by:
func: avg
duration: 1h
show:
legend_value: false
- type: custom:apexcharts-card
header:
show: true
title: PM10 (10m average)
show_states: true
colorize_states: false
graph_span: 24h
experimental:
color_threshold: true
span:
start: day
now:
show: true
label: now
color: red
series:
- entity: sensor.apollo_air_1_cc6b64_pm_10_m_weight_concentration
name: PM10
stroke_width: 3
fill_raw: last
extend_to: now
show:
legend_value: false
group_by:
func: avg
duration: 10min
color_threshold:
- color: rgb(126,0,35)
value: 425
- color: rgb(143,63,151)
value: 355
- color: rgb(255,0,0)
value: 255
- color: rgb(255,126,0)
value: 155
- color: rgb(255,255,0)
value: 55
- color: rgb(0,228,0)
value: 0
- entity: sensor.apollo_air_1_cc6b64_pm_10_m_weight_concentration
name: PM10
color: orange
opacity: 0.3
stroke_width: 3
fill_raw: last
show:
in_header: false
legend_value: false
offset: '-24h'
group_by:
func: avg
duration: 10min
color_threshold:
- color: rgb(126,0,35)
value: 425
- color: rgb(143,63,151)
value: 355
- color: rgb(255,0,0)
value: 255
- color: rgb(255,126,0)
value: 155
- color: rgb(255,255,0)
value: 55
- color: rgb(0,228,0)
value: 0
- type: custom:apexcharts-card
header:
show: true
title: PM2.5 (10m average)
show_states: true
colorize_states: false
graph_span: 24h
experimental:
color_threshold: true
span:
start: day
now:
show: true
label: now
color: red
series:
- entity: sensor.apollo_air_1_cc6b64_pm_2_5_m_weight_concentration
name: PM10
stroke_width: 3
fill_raw: last
extend_to: now
show:
legend_value: false
group_by:
func: avg
duration: 10min
color_threshold:
- color: rgb(126,0,35)
value: 35.5
- color: rgb(143,63,151)
value: 35.5
- color: rgb(255,0,0)
value: 35.5
- color: rgb(255,126,0)
value: 35.4
- color: rgb(255,255,0)
value: 12
- color: rgb(0,228,0)
value: 0
- entity: sensor.apollo_air_1_cc6b64_pm_2_5_m_weight_concentration
name: PM10
color: orange
opacity: 0.3
stroke_width: 3
fill_raw: last
show:
in_header: false
legend_value: false
offset: '-24h'
group_by:
func: avg
duration: 10min
color_threshold:
- color: rgb(126,0,35)
value: 250.5
- color: rgb(143,63,151)
value: 150.5
- color: rgb(255,0,0)
value: 55.5
- color: rgb(255,126,0)
value: 35.5
- color: rgb(255,255,0)
value: 12.1
- color: rgb(0,228,0)
value: 0
- type: custom:apexcharts-card
header:
show: true
title: CO2 (10m average)
show_states: true
colorize_states: false
graph_span: 24h
experimental:
color_threshold: true
span:
start: day
now:
show: true
label: now
color: red
series:
- entity: sensor.apollo_air_1_cc6b64_co2
name: CO2
stroke_width: 3
fill_raw: last
extend_to: now
show:
legend_value: false
group_by:
func: avg
duration: 10min
color_threshold:
- color: '#FF0000'
value: 5000
- color: '#FFA500'
value: 2000
- color: '#FFFF00'
value: 1000
- color: '#008000'
value: 0
- entity: sensor.apollo_air_1_cc6b64_co2
name: CO2
color: orange
opacity: 0.3
stroke_width: 3
fill_raw: last
show:
in_header: false
legend_value: false
offset: '-24h'
group_by:
func: avg
duration: 10min
color_threshold:
- color: '#FF0000'
value: 5000
- color: '#FFA500'
value: 2000
- color: '#FFFF00'
value: 1000
- color: '#008000'
value: 0
- type: custom:apexcharts-card
header:
show: true
title: VOC (10m average)
show_states: true
colorize_states: false
experimental:
color_threshold: true
graph_span: 24h
span:
start: day
now:
show: true
label: now
color: red
series:
- entity: sensor.apollo_air_1_cc6b64_sen55_voc
name: VOC
stroke_width: 3
show:
legend_value: false
extend_to: now
fill_raw: last
group_by:
func: avg
duration: 10min
fill: last
color_threshold:
- color: '#FF0000'
value: 400
- color: '#FFA500'
value: 250
- color: '#FFFF00'
value: 150
- color: '#008000'
value: 0
- entity: sensor.apollo_air_1_cc6b64_sen55_voc
name: VOC
opacity: 0.5
stroke_width: 3
fill_raw: last
show:
in_header: false
legend_value: false
offset: '-24h'
group_by:
func: avg
duration: 10min
fill: last
color_threshold:
- color: '#FF0000'
value: 400
- color: '#FFA500'
value: 250
- color: '#FFFF00'
value: 150
- color: '#008000'
value: 0
- type: custom:apexcharts-card
header:
show: true
title: NOx (10m average)
show_states: true
colorize_states: false
experimental:
color_threshold: true
graph_span: 24h
span:
start: day
now:
show: true
label: now
color: red
series:
- entity: sensor.apollo_air_1_cc6b64_sen55_nox
name: NOx
show:
legend_value: false
stroke_width: 3
fill_raw: last
extend_to: now
group_by:
func: avg
duration: 10min
color_threshold:
- color: '#FF0000'
value: 300
- color: '#FFA500'
value: 150
- color: '#FFFF00'
value: 20
- color: '#008000'
value: 0
- entity: sensor.apollo_air_1_cc6b64_sen55_nox
name: NOx
opacity: 0.5
stroke_width: 3
fill_raw: last
show:
in_header: false
legend_value: false
offset: '-24h'
group_by:
func: avg
duration: 10min
color_threshold:
- color: '#FF0000'
value: 300
- color: '#FFA500'
value: 150
- color: '#FFFF00'
value: 20
- color: '#008000'
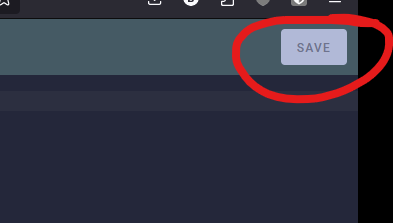
value: 0Now click save in the top right and remember to not hit any buttons or make any other edits before saving!
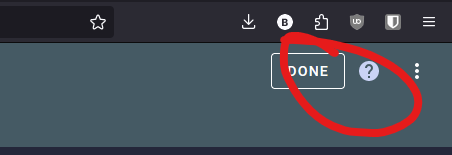
Finally hit "done" in the top right.
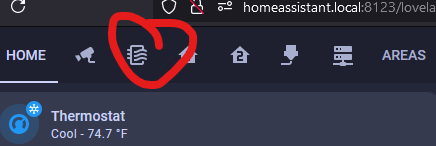
Hit F5 on your keyboard or refresh your browser and then look for your new "Air Icon" as a new dashboard option and click on it!
Lastly, we do want to thank firstof9 for creating this dashboard and sharing it.